Most reliable candlestick patterns for stocks
Most Reliable Candlestick Patterns for Stocks
Introduction
Trading with candlesticks isn’t about chasing a magic signal. It’s about reading price psychology in real time and layering context—trend, volume, and risk controls—so patterns stop feeling like luck. This piece highlights the most reliable candlestick patterns for stocks, how they tend to behave across asset classes, and practical tips to make them part of a disciplined trading approach. You’ll also see the broader tech backdrop—DeFi hurdles, smart contracts, and AI-driven tools—that shape how these signals fit into prop trading and beyond.
Patterns that stand up to scrutiny
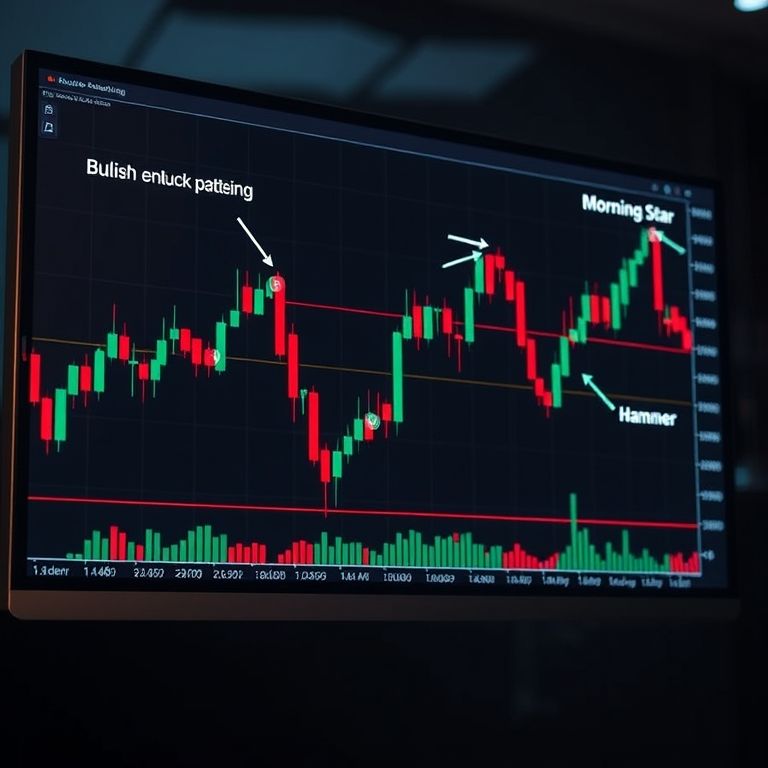
- Hammer and Hanging Man: A long lower or upper shadow with a small body can hint reversals, but context matters. In a downtrend, a hammer near support with volume can precede a bounce; in an uptrend, a hanging man warrants confirmation before treating it as a top. Real-life takeaway: watch the candle’s location and confirm with the next session’s move.
- Engulfing patterns (bullish and bearish): A larger opposite-colored candle fully engulfs the prior one, signaling potential trend shift. Reliability grows with breakout strength and volume pickup. Example: a bullish engulfing after a pullback in a steady uptrend often leads to renewed upside pressure.
- Morning Star / Evening Star: A three-candle sequence that marks a pivot—bearish to bullish or vice versa—when accompanied by conviction in the third candle. These patterns shine when they appear after a clean trend and with decent volume.
- Doji family (standard, long-legged, gravestone, dragonfly): Doji signals indecision; their value comes from where they appear and whether a subsequent candle confirms a new direction. In crowded ranges, doji signals can fade, so pairing with trend and momentum helps.
- Piercing Line / Dark Cloud Cover: Two-candle reversals that work best after a clear move and with a sizable intraday retracement. The second candle’s close relative to midpoint matters for strength.
How to use them in practice
- Align with trend and wait for confirmation. Patterns depreciate when the market is choppy; they gain power in established momentum.
- Combine with volume and simple indicators (moving averages, MACD, RSI divergences) to avoid chasing false signals.
- Manage risk with precise stops—placing them beyond the pattern’s tail or the nearest support/resistance, and sizing trades to tolerate pullbacks.
Across assets and emerging realities
- Stocks show these patterns most cleanly, but forex and indices echo similar dynamics; crypto can be spiky, yet recognizable candlestick order still appears after pullbacks. Options add complexity, as time decay colors the payoff of a pattern; commodities mirror traditional price cycles. In a diversified classroom, these patterns teach patience, not shortcuts.
DeFi, challenges, and the road ahead
- Decentralized finance brings new data sources and liquidity pools, but price discovery is fragmented and smart contracts introduce new risk vectors (oracle delays, slippage, liquidity fragmentation). Pattern reading in this world benefits from on-chain analytics and cautious risk budgeting.
Future trends: smart contracts, AI, and prop trading
- Smart contracts enable programmable strategies that automate pattern-based entries with defined risk limits. AI tools help filter noisy charts, validate pattern strength, and adapt to regime changes. Prop trading will increasingly rely on a blended toolkit—pattern signals + risk models + on-chain data—to scale across assets, from forex and stocks to crypto and commodities.
Promotional cue and closing thought
Most reliable candlestick patterns for stocks aren’t about guessing the market; they’re about recognizing disciplined signals that ride with price, not against it. Trade with confidence by grounding patterns in context, volume, and risk discipline—and watch the broader shift toward AI-assisted, contract-driven markets. A simple slogan to keep in mind: trust the chart, confirm with data, trade with purpose.